Inside Go's Garbage Collector: why does it take pauses? How can you write better GO to reduce GC Overhead

In the initial days of learning GO you might have heard this sentence from time to time, "GO has unpredictable pause times", this shows up everywhere reddit, X people arguing about why they chose Rust or c++ over go for their low-latency product. but actually GO's team has fixed this in the 1.5 release which happened in August 19, 2015 Go now uses the tri-color mark-and-sweep collector, and pause times have been driven down to sub-millisecond levels. now if you think "If go team has fixed this 10 years ago and the stop times are <1ms" then why do still people argue? well that's what we're about to cover in this write-up There's more to garbage collection than STW(Stop the World) pauses.
Quick Intro on Garbage Collection
Garbage collection is a form of automatic memory management, instead of the programmer manually allocating and deallocating memory (malloc/calloc) in C. The language runtime keeps track of the objects that are still reachable (referenced somewhere in the program) and reclaims the memory of the objects that are no longer reachable.
Manual memory-management is powerful but error-prone two classic bugs it causes are:
- Memory leaks - forgetting to free memory that's no longer needed.
- use-after-free/dangling pointers: freeing memory that's still being used elsewhere and accessing it later.
Most GCs use some variant of reachability analysis. Starting from a set of "roots" (global variables, stack variables, CPU registers), the collector walks the graph of object references. Anything reachable from a root is considered "live." Anything not reachable is garbage and can be reclaimed.
Common strategies include:
- Mark and sweep: mark all reachable objects, then clear the rest (unreachable).
- Reference counting: every object tracks how many references point to it. If the counter reaches zero, then the object is removed.
- Generational GC: objects are split into old and new generations. New generation objects are scanned frequently and old generation objects are scanned rarely. New objects get into new generation and if the object survives multiple times it gets moved to the old generation.
- Tri-color / concurrent marking: marks the objects concurrently with the program, minimizing the STW pauses (we'll discuss this in detail).
The Spectrum of Memory Management
Manual Memory Management (C/C++)
The programmer manually creates (malloc/new) and frees (free/delete) every place of heap memory. nothing happens automatically The best part about this is there's no background process scanning memory, so performance is entirely predictable. this is why c/c++ dominates embedded systems and os kernels.
RAII
in c++ there's a thing called RAII(Resource acquisition is initialization) When an object leaves its scope, its destructor runs immediately. You don't have to wait for a garbage collector.
for example, this is the code snippet from my container runtime project Aegis destructor gets called the moment an object goes out of scope, teardown() is a custom function which as the name suggests, tears down all the resources it has ever created.
Since the allocated resources are cleared within the object lifecycle itself, there is no need for a seperate GC.
// constructorNetwork::Network(pid_t pid) : pid(pid) { veth_host = "veth0_" + std::to_string(pid); veth_container = "veth1"; bridge = "bridge_" + std::to_string(pid); } // RAII (Resource Acquisition Is Initialization)// lifecycle of resources is tied to the lifecycle of the object // DestructorNetwork::~Network(){ teardown(); }This makes resource management safe and predictable, even if an exception is thrown.
Full control over memory-management has its own downsides too. Developers are clumsy and we make mistakes
- Use-after-free bugs: accessing memory after it's been freed, leading to undefined behavior or exploitable security vulnerabilities.
- Double-free errors: freeing the same pointer twice, corrupting the allocator's internal bookkeeping.
- Memory leaks: forgetting to free memory at all, especially in complex code paths with early returns or exceptions.
- Dangling pointers: pointers that still "look valid" but point to freed or reallocated memory.
Traditional VM-Based Garbage Collection (Java/JVM)
The runtime automatically tracks object reachability and reclaims memory nobody references anymore. The programmer never calls free.
This eliminates the whole bunch of bugs we talked about in c++. no use-after-free, no double-free, no manual leak-hunting
High Throughput
Say your app runs for 100 seconds.
- 95 seconds doing actual work
- 5 seconds doing GC
95 / 100 = 95%So yeah, 95% useful work.
If GC takes 20 seconds instead:
80%Not great.
If your app uses something like 300 GB RAM, cleaning that all at once is slow.
Old GCs would pause everything.
New ones like G1, Shenandoah, ZGC clean in small chunks while your app keeps running. Less pause, better throughput.
Generational GCs
over the years upon observing how programs behave engineers noticed *most objects die very soon after they're created* This is called generational Hypothesis.
so what did engineers do? Instead of putting every object in one giant bucket they split the heap into generations.
Young Generation Old Generationevery object starts with the young generation bucket. Once it survives multiple cleanup cycles it gets moved to the old generation bucket.
Now because of this clever idea garbage collector doesn't have to check on all objects everytime. objects in young generation receive frequent cleanup cycles and objects in old generation gets rarely.
The complexity/cost side:
- Stop-the-world pauses: Even modern GCs pause the application at times, causing unpredictable latency spikes.
- Complex tuning: Production JVMs often require careful GC and memory tuning using numerous JVM flags.
- Higher memory usage: The JVM typically needs extra memory beyond live data to keep GC efficient.
- Object overhead: Every Java object includes metadata, making it larger than equivalent low-level structures like C structs.
Go: The Middle Path
Go sits between these two extremes
cool thing about GO's is individual requests are much more predictable. let's say a java program processes 100,000 requests/min ocassionally pauses 50-100ms due to GC these pauses some individual requests but the server gets done more work overall.
now the same program in GO processes 950,000 requests/min GC pauses are tiny (<1ms) individual requests are much more predictable. this is crucial for
- HTTP servers
- Microservices
- RPC services
a request suddenly taking 100 ms instead of 5 ms is often worse than serving 5% fewer requests overall. So Go intentionally sacrifices a bit of maximum throughput to keep tail latency (p99/p999) low.
Go's authors (Pike, Griesemer, Taylor) explicitly optimized for:
- Low-latency over throughput: Go's GC is optimized for short, predictable pause times instead of maximizing raw throughput, making it well-suited for backend services.
- Simple to tune: Only a few knobs like
GOGCandGOMEMLIMITare usually enough, unlike the JVM's extensive GC configuration. - Concurrent collection: The GC runs alongside your program using a concurrent mark-and-sweep algorithm, minimizing stop-the-world pauses.
- Non-moving GC: Objects aren't relocated during collection, avoiding pointer updates and keeping the runtime simpler, though with some memory trade-offs.
- Stack allocation via escape analysis: Go's escape analysis pushes as many objects as possible onto the stack instead of the heap, which steps away GC involvement entirely for a large fraction of allocations. This is a big reason Go can get away with a simpler GC. it reduces the GC's job before it even starts.
| Dimension | C/C++ | Java/JVM | Go |
|---|---|---|---|
| Who manages memory | Programmer | Runtime (heavy) | Runtime (light) |
| Tuning knobs | N/A | Dozens | ~1-2 (GOGC, GOMEMLIMIT) |
| Pause time priority | N/A | Throughput-first (historically) | Latency-first |
| Safety | None | Full | Full |
| Compaction | N/A | Yes (moves objects) | No |
| Typical use case | OS/embedded/games | Enterprise batch/big heaps | Networked services, CLIs, infra tooling |
GO's GC Architecture (Deep Dive)
Memory in GO
GO's memory management involves inovolves both the Stack and Heap data structures. Depending on the nature and lifecycle of data, one of these structures is chosen. The compiler does Escape analysis to determine whether this variable goes to the stack or heap.
Each time a function is invoked, a new stack frame is allocated with all the function’s local variables. When the function finishes executing, its stack frame is deallocated, freeing up the memory for subsequent use. The stack is fast and provides automatic memory management. (We need garbage collector only for the heap)
Heap is a region for dynamic memory management. unlike stack heap has no order, memory in heap can be allocated and deallocated anytime. This flexibility comes with a cost of manual memory management and slower access times. Data that needs to outlive the function scope goes to the heap.
In GO the size of the heap is managed by the Garbage collector. Go's runtime will increase the size of the heap if there's not enough space.
Unlike some languages where the stack size must be defined at thread creation, Go starts each goroutine with a small stack, usually around 2KB, which can dynamically grow and shrink as needed. When a goroutine requires more stack space, the runtime allocates a larger contiguous stack and copies over the existing data.
Some jargons related to GC
GO's garbage collection involves a concurrent tri-color mark and sweep approach. This makes GC causing no trouble to the application performance.
let's break down each term for better understanding
Concurrent - the term concurrent signifies that the garbage collection doesn't stop the execution of the application. traditional garbage collectors often implement a "stop-the-world" pause, during which the garbage collector examines and reclaims memory. Which cannot be ideal for some application workloads. Go’s GC, on the other hand, is designed to work concurrently with the program. Most of the garbage collector’s work is done in the background, alongside the application’s execution. This results in shorter stop-the-world pauses, improving the overall latency of Go applications.
Tri-color - the tri-color refers to the marking algorithm used by the GO's garbage collector which considers objects (or blocks of memory) as three different colors - white, grey, black.
- white: objects those the garbage collector has not processed (or the GC hasn't seen yet).
- grey: objects those the gc has discovered but the descendants(objects they reference) hasn't been processed yet
- black: objects those and their descendants has been processed.
Initially all objects starts white, gc starts from the roots and colors them grey as it moves, After processing all the objects referenced by a grey object it colors it black.
This clear segregation of objects based on their reachability status assists in GC identifying and reclaiming memory efficiently.
Mark-sweep: Mark phase - During this phase the GC traverses the graph from the roots as described in the tri-color marking algorithm to discover all reachable objects. This Marking phase runs concurrently with the application with the help of goroutines spawned by the garbage collector. These goroutines concurrently executes the marking work without much disturbing the application code execution.
Sweep phase - Once all reachable objects are marked (black), the sweep phase begins. During this phase, the garbage collector reclaims the memory occupied by white (unreachable) objects. This phase also happens concurrently with the execution of Goroutines, cleaning up a bit of memory at a time.
Pacer:
pacer is the manager of the Garbage collector Its job is not to mark objects, it takes care of these
- When should GC start?
- How much marking work should happen right now?
- Should the mutator (your program) help with marking?
- Are we falling behind?
- Are we marking too aggressively?
The Tri-color Mark-and-Sweep Algorithm
In the context of Garbage collection the "Marking" phase involves traversing the object graph from the roots and marking every object that can be reached. Then the "Sweep" phase goes on to reclaim all the objects which are no longer referenced(unreachable).
The tri-color model visualizes objects in three colors white, grey and black. Initially all objects are marked as white denoting they are candidates for garbage collection. then the root objects are marked as grey which tells us the descendants of these objects are not processed yet. The GC successfully progresses through objects and marks the objects grey as it sees them. Once all the object referenced by a grey object has been turned grey, it gets painted to black. This process continues until there are no more grey objects.
All the white objects that are left now can be considered garbage and swept away.
Write barriers
Say object A is black (already scanned) and object B is white (not yet visited). The application does:
A.field = B // black now points to whiteIf this happens _and_ nothing else points to B, the collector will never visit B again it's black, so it's done and B gets swept as garbage even though it's live and reachable via A.
The classic "hiding" scenario makes this concrete with three objects:
Ais black,A.field = C(grey), andBis white.- Mutator does
A.field = B(steals reference, now A points to B, not C). - Mutator does
C.field = nil(severs the only other path to B).
Now B is reachable only through the black object A, which the GC will never rescan. B gets collected out from under a live pointer. This is a use-after-free, and in a memory-safe language like Go that's an unacceptable failure mode it would corrupt memory.
To prevent this, Go's compiler inserts a write barrier a small piece of code that runs on every pointer write to heap memory, _but only during GC cycles_. Instead of compiling A.field = B as a raw store, the compiler emits something conceptually like:
writePointer(&A.field, B)where writePointer is:
func writePointer(slot *unsafe.Pointer, ptr unsafe.Pointer) { if writeBarrierEnabled { shade(ptr) // ensure the new pointee isn't left white so the GC rescans it } *slot = ptr}This is what Write barrier is every pointer write goes through the write barrier when the GC cycle is running.
The Pacing Algorithm & GC Triggers
Go's GC doesn't run on a timer. It runs when a heap growth target is about to be exceeded, and that target is recomputed every cycle based on live heap size and GOGC.
The target rule (GOGC)
At the end of each GC cycle, the runtime measures the current live heap size call it heapMarked. It then computes a target for the _next_ cycle:
target = heapMarked + heapMarked * (GOGC / 100)GOGC defaults to 100, meaning: let the heap double before the next GC starts. If heapMarked is 4MB, the runtime lets the heap grow to ~8MB before triggering the next cycle.
Set GOGC=50 and you get a 1.5x target more frequent GCs, less memory, more CPU burned on collection.
Set GOGC=200 and you get 3x fewer GCs, more memory headroom, less CPU overhead.
GOGC=off disables the heap-based trigger entirely (only GOMEMLIMIT, if set, will still trigger a collection).
GOMEMLIMIT
The GOGC ratio-based target works fine when live heap size is roughly stable, but it has a blind spot: it says nothing about absolute memory in bytes. A container with a 512MB limit running a service whose live heap grows from 50MB to 300MB will happily let the heap target climb to 600MB under GOGC=100 and get OOM-killed by the kernel or orchestrator before Go's GC ever felt pressured to intervene.
GOMEMLIMIT introduced in (go1.19+) helps set a soft cap on total memory. Once set (via runtime/debug.SetMemoryLimit() or the GOMEMLIMIT env var), the runtime treats it as an additional, tighter target: it will run GC more frequently and aggressively as usage approaches the limit, even if the GOGC-based doubling target hasn't been reached yet.
Downsides to Garbage collection in GO
GO's GC buys you memory safety and low STW pauses but that concurrency isn't completely free. The GC steals some CPU cycles from your actual workload.
Breakdown
Stolen CPU (the 25% tax)
Go's design goal is to keep the GC using no more than ~25% of available CPU during a collection cycle(this is a soft target, not a guarantee). On a machine with GOMAXPROCS=4, that can mean up to one full core's worth of throughput getting redirected into marking work during every GC cycle.
This is the fundamental trade Go made: instead of one big STW pause, you get many small background pauses spread across the entire cycle. Imagine you have 8 CPU Cores, 6 cores are doing useful application work. The other 2 are tracing the object graph. So your throughput drops by roughly 25% during that period.
Mark Assist
If your application allocates memory faster than the background mark workers can keep up the runtime doesn't just let the heap overshoot, it forces the _allocating goroutine itself_ to pause and do mark work before its allocation is allowed to proceed. This is called mark assist.
Write Barrier
Remember the write barrier we spoke about earlier? This isn't free even in the "good" case every pointer store during an active cycle does extra bookkeeping. Programs with pointer-heavy data structures (trees, linked lists, deeply nested structs with pointer fields) pay this cost more than programs using flat, low-pointer data layouts like arrays of value types. This is part of why idiomatic "fast" Go tends to favor []struct{} over []*struct{} fewer pointers means less write-barrier overhead and less marking work per cycle, not just less allocation.
Memory Overhead Beyond the Live Set
Go intentionally allows the heap to grow beyond the amount of memory your program is actively using. By default (GOGC=100), after a GC cycle finishes, the heap can grow to roughly twice the size of the current live data before another collection begins. This extra headroom lets the garbage collector run less frequently, reducing CPU overhead and improving throughput. Lowering GOGC reduces the heap size but causes GC to run more often, increasing CPU cost, while raising it does the opposite. Since throughput is what matters the most GO trades it for some extra memory (so it's manageable)
Scan Cost Scales With Heap Shape, Not Just Heap Size
A GC cycle's marking cost is roughly proportional to the number of pointers it has to trace, not the number of bytes in the heap. A 1GB heap made of a few large []byte buffers scans almost instantly (few pointers to chase). A 1GB heap made of millions of small pointer-heavy structs can take dramatically longer to mark, because the collector has to walk every one of those pointer fields. This means two Go programs with identical heap sizes can have wildly different GC overhead depending purely on data structure choice
No Control Over Collection Timing
Unlike manual free() or Rust's deterministic drop-at-scope-exit, you don't get to say "collect exactly now, while I have idle CPU" or "never collect during this latency-critical section." debug.SetGCPercent and runtime.GC() exist, but they're blunt instruments there's no per-request or per-goroutine way to defer collection. For latency-sensitive systems (trading systems, real-time bidding, anything where latency matters), this lack of fine-grained control is often the actual reason teams reach for Rust or manual pooling (sync.Pool, object reuse) instead of trusting the collector to stay out of the way during the exact millisecond it matters most.
Profiling & Detecting GC Overhead
gctrace
There's a way to watch a program's GC behavior in real time. Setting GODEBUG=gctrace=1 before running any Go binary and the runtime prints one line per GC cycle straight to stderr no code changes, no build flags.
Here's a sample image for better understanding
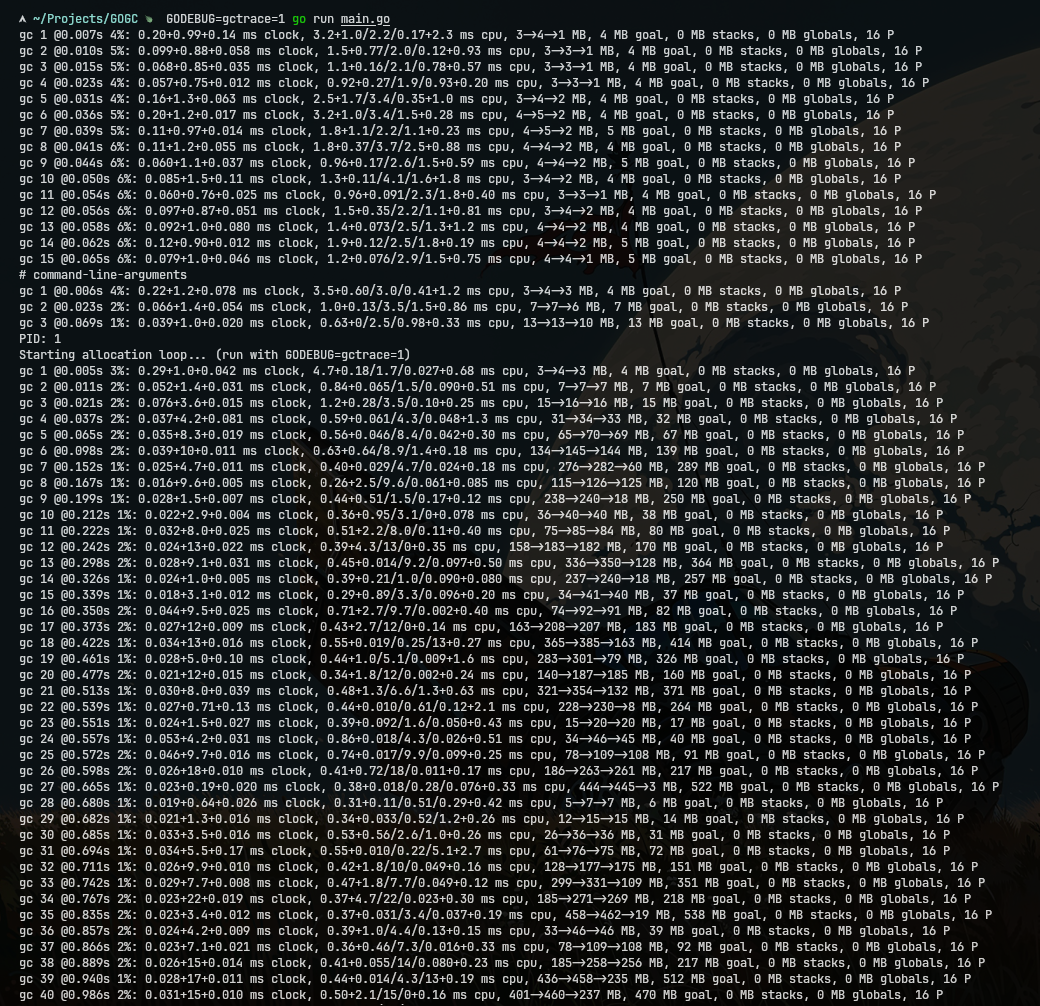
It looks dense, but every field maps directly to concepts from the pacing/tricolor sections. Let's break it apart piece by piece.
- gc 3 — Third garbage collection cycle.
- @0.215s — GC started 215 ms after the program began.
- 2% — Total runtime spent in GC so far.
- 0.021 + 1.2 + 0.010 ms (clock) — Wall-clock time:
- 0.021 ms — STW sweep termination.
- 1.2 ms — Concurrent marking (program keeps running).
- 0.010 ms — STW mark termination.
- 0.084 + 0.35/1.1/2.3 + 0.040 ms (cpu) — CPU time used by each phase. The middle values are CPU spent on marking by assists, background workers, and idle workers.
- 4 → 5 → 2 MB — Heap usage:
- 4 MB — Heap at GC start.
- 5 MB — Heap at end of marking.
- 2 MB — Live heap after sweeping.
- 5 MB goal — Heap target that triggered this GC cycle.
- 0 MB stacks — Memory used by goroutine stacks.
- 0 MB globals — Memory used by global variables scanned as GC roots.
- 8 P —
GOMAXPROCS: 8 logical processors available for Go to run goroutines and GC work.
memprofile
This is a built-in flag for Go's testing tool. When you run a benchmark or a test, this flag tells Go to sample the memory allocations and write the data to a file. It tracks heap allocations. It counts both the _number of objects_ allocated and the _total bytes_ allocated. This is specifically used when writing benchmarks, when you write a new database driver or parser, you run a benchmark with this flag to see exactly how much garbage it generates per operation.
runtime/pprof
This is a standard library package (import "runtime/pprof") that lets you instrument your actual application code to capture profiles on demand while the binary is running. Go's runtime tracks heap memory allocations continuously from the millisecond the application boots up. once the control reaches this line it writes the profile out to a file (or expose it via an HTTP endpoint using net/http/pprof).
code sample:
package main import ( "os" "runtime/pprof") func main() { f, _ := os.Create("mem_prod.out") defer f.Close() // Capture the current heap state pprof.WriteHeapProfile(f)}alloc objects vs inuse objects
alloc_objects - the cumulative total number of objects ever allocated at that call site since the program (or benchmark) started, whether or not they're still alive. This never decreases.
`inuse_objects` - the number of objects that are still reachable at the moment the profile was taken (i.e., they'd survive a GC). This tells you about your actual _live heap footprint_ what's really sitting in memory right now and why.
gcflags="-m"
the -gcflags=-m flag commands the compiler to print optimization decisions, specifically regarding memory allocation and function inlining
let's build a sample code with this flag and observe what happens
sample code:
package main import "fmt" type point struct{ x, y int } func makeOnStack() point { p := point{1, 2} return p // returned by value — safe to stack-allocate} func makeOnHeap() *point { p := point{1, 2} return &p // pointer escapes — must go to heap} func main() { a := makeOnStack() b := makeOnHeap() fmt.Println(a, b)}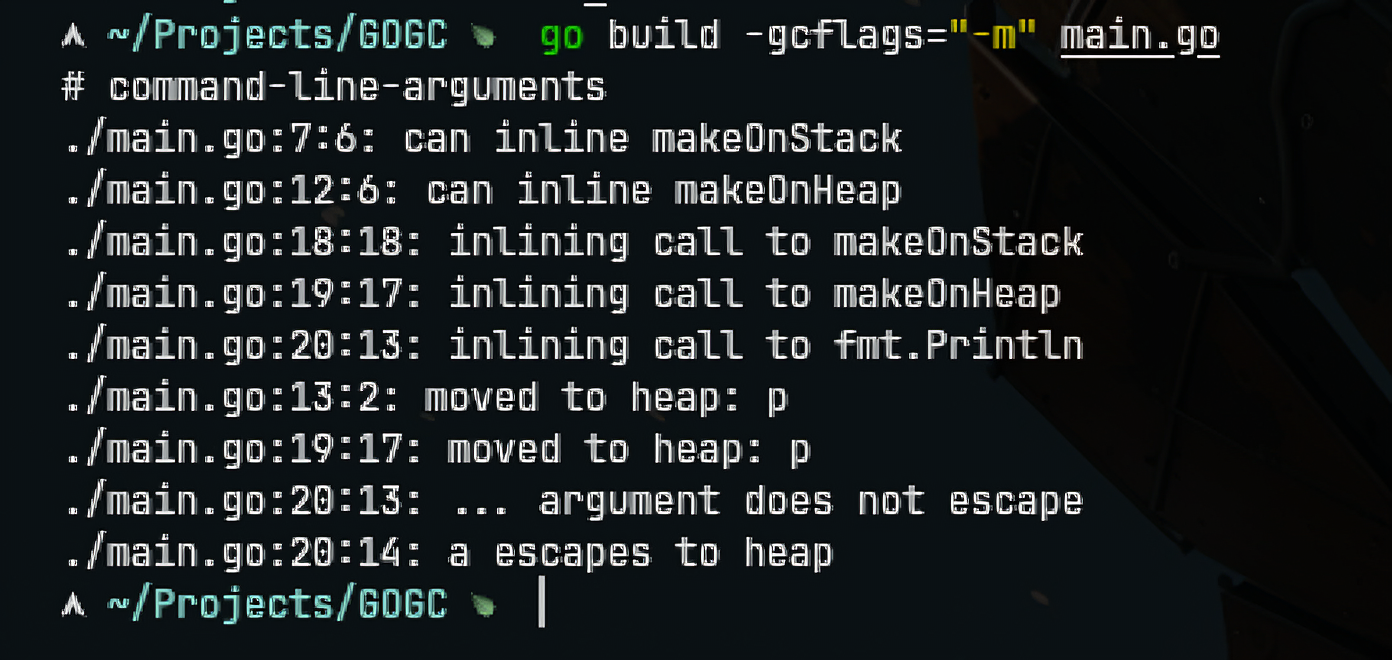
`can inline makeOnStack` / `can inline makeOnHeap` the compiler decided both functions are small/simple enough to inline directly into their call sites, rather than emitting real function calls. This happens _before_ escape analysis runs, and it changes the analysis entirely there's no longer a function boundary to reason about, just one flattened body.
inlining call to makeOnStack/makeOnHeap confirms the substitution actually happened(I mean the compiler literally replaces the function call with a copy of the function's body)
rest of the lines in the output explains itself on its own.
Code Patterns to Minimize GC Overhead
Pre-allocating Slices and Maps
Bad: unbounded growth
func buildIDs(n int) []int { var ids []int for i := 0; i < n; i++ { ids = append(ids, i) } return ids}Every time the backing array runs out of room, append allocates a new, larger array and copies everything over.
Good: pre-allocate with known capacity
func buildIDs(n int) []int { ids := make([]int, 0, n) for i := 0; i < n; i++ { ids = append(ids, i) } return ids}One allocation. append just writes into existing capacity until it's full.
Reusing Memory with sync.Pool
Imagine you have a hot path in your code and your server handles 100,000 requests per second. Every request allocates a buffer and GC frees it. so for 100k requests that's 100k objects become garbage GC has to clean 100k buffers.
instead of throwing buffers away you can use sync.Pool to reuse them.
sample code:
var bufPool = sync.Pool{ New: func() any { return new(bytes.Buffer) },} func handleRequest(w io.Writer, data []byte) error { buf := bufPool.Get().(*bytes.Buffer) buf.Reset() defer bufPool.Put(buf) buf.Write(data) // ... transform, encode, whatever ... _, err := w.Write(buf.Bytes()) return err}`New` is only called when the pool is empty
Avoiding Pointers in Map Keys and Values
The GC's mark phase has to scan every pointer-containing object to trace what it points to. For a map, that means walking every bucket if the key or value type contains a pointer.
// GC must scan every bucket, every entry, to find and trace the *User pointersm := make(map[string]*User)If m has 5 million entries, that's 5 million pointers the GC has to trace on every mark cycle, even if nothing in the map changed. This is a classic source of GC-pause blowup
The fix: use pointer-free key and value types. Go's runtime marks a type as pointer-free via its type descriptor (kind & kindNoPointers), and for a map where both key and value are pointer-free, the entire bucket array can be skipped during scanning not just skipped-per-entry, skipped entirely.
// GC-invisible: no pointers in key or value, so buckets are never scannedm := make(map[uint64]User) // User is a flat struct: no pointer/slice/map/string/interface fieldsIf User itself has to contain pointer-like fields (strings, slices, interfaces), you can still flatten:
type User struct { ID uint64 Name [32]byte // instead of string, if fixed-width is acceptable Score float64}Strings vs. Byte Slices
Strings in Go are immutable every concatenation allocates a new backing array and copies both operands in.
// Bad: O(n²) allocations across the loopfunc buildCSV(rows [][]string) string { var out string for _, row := range rows { for _, field := range row { out += field + "," } out += "\n" } return out}Each += allocates a new string sized for the combined length. For n concatenations, you get roughly n allocations with steadily growing copy sizes quadratic total work.
Fix 1: strings.Builder
func buildCSV(rows [][]string) string { var b strings.Builder b.Grow(estimateSize(rows)) // optional, but avoids Builder's own regrowth for _, row := range rows { for _, field := range row { b.WriteString(field) b.WriteByte(',') } b.WriteByte('\n') } return b.String()}strings.Builder accumulates into an internal []byte once, at the end, via a zero-copy cast(Go simply creates a string header pointing at the same bytes) no final copy.
Fix 2: zero-copy conversions in hot paths (unsafe)
Normally, string(byteSlice) and []byte(str) both copy, because the compiler has to preserve the immutability guarantee of string and the mutability of []byte. If you _know_ the byte slice won't be mutated after conversion (or the string won't outlive the buffer), you can skip the copy:
import "unsafe" // []byte -> string, zero-copy (Go 1.20+)func bytesToString(b []byte) string { return unsafe.String(unsafe.SliceData(b), len(b))} // string -> []byte, zero-copy — CAUTION: resulting slice must not be written tofunc stringToBytes(s string) []byte { return unsafe.Slice(unsafe.StringData(s), len(s))}There's a catch: This breaks the GO's memory model. If you convert a string to []byte this way and then mutate the slice, you've mutated a value the runtime and other code assume is immutable. you might run into potential data races, corrupted strings, or worse if the string was a compile-time constant living in read-only memory. Use this only in narrow, well-audited hot paths (e.g., serialization code where you fully control the lifetime), never as a general substitute for strings.Builder.
Summary & Best Practices
Don't prematurely optimize
Every technique in this post pre-allocation, sync.Pool, pointer-free maps, unsafe string conversions trades readability or safety margin for throughput. That trade is only worth making where it matters, and "where it matters" is not a guess.
The discipline is: write clean code first, profile second, optimize third.
- Write clean code first. Use idiomatic Go plain slices, plain maps, and simple string concatenation unless you're in a hot loop. Most of your code won't be performance-critical, so keeping it clear and maintainable is usually the right choice.
- Profile second. Use
pprof(viago tool pprof,runtime/pprof) to find where CPU time and allocations actually go. Instead of guessing what's expensive, measure it. CheckGODEBUG=gctrace=1as well to see if GC is even a bottleneck before trying to optimize around it. - Optimize third, and only the hot path. Apply techniques like pre-allocation, pooling, or reducing pointer usage only where profiling shows they matter not across the entire codebase. A
map[string]*Userused once during startup doesn't need to become amap[uint64]User. The same structure in a request path with millions of entries is a different story.
The main reason for following this approach is that optimizations like sync.Pool or unsafe conversions often trade readability or safety for performance. If you haven't measured a real bottleneck, that trade-off usually isn't worth making.
Cheatsheet
| Strategy | When to use it | How |
|---|---|---|
| Pre-allocate slices and maps | When you roughly know how many elements you'll store | Use make([]T, 0, n) or make(map[K]V, n) to avoid repeated growth and copying. |
| Reuse with `sync.Pool` | When expensive objects are created repeatedly (buffers, large structs) | Reuse objects from a pool. Call Reset() before reuse and Put() them back when done. |
| Reduce pointers in large collections | When huge maps make GC expensive | Store values directly, flatten data into slices, or use IDs instead of pointers where practical. |
| Use `strings.Builder` | When building strings inside loops | Append to a strings.Builder instead of repeatedly using +=. |
| Tune `GOGC` / `GOMEMLIMIT` | When memory usage or GC behavior becomes a bottleneck | Adjust GOGC for the CPU vs. memory trade-off, and use GOMEMLIMIT to cap memory usage. |
cheers ^-^